
ART19’s content analytics are updated in near real-time, with best-in-class, actionable data about your series and episodes.
Table of Contents:
Features
- Download and unique listener metrics for series and episodes
- Ability to filter your data by date range
- Ability to breakout series and episode downloads by time unit (hour, day, week, month)
- Ability to view download data by Country, Region/State, City, and DMAs
- Ability to export data as a CSV from most table views
Date Range Filter
You can change the date range for your data at any time by selecting the Calendar button on the top right. This will display a panel with a Date Range dropdown menu where you can select a preset date range such as Last 90 Days, or enter a custom range. This filter is not available on the Overview or Episode Comparison pages.
Once selected, your filter will show up as a badge next to the Filters button. The selected date range affects all the data across pages and reports, on the Performance, Content, and Audience pages. The selected date range does not affect the Overview page or Episode Comparison page.
Series Analytics
Overview Page
The series Overview tabs display downloads for today, Last 7 days, Last 30 Days, and All Time, with % changes compared to the previous period. You can click on each tab to see its corresponding chart which also displays unique listeners. You can toggle between a line and bar chart using the buttons in the right corner.
You can also see the download performance of your latest episodes, and the top locations and listening platforms for your series downloads in the Last 30 days.
Performance Page
The Performance page shows total downloads and unique listeners for your series, with breakouts by time unit (hour, day, week, month) over your selected date range. You can toggle between a line and bar chart using the buttons underneath the export button. You can change the time unit using the dropdown menu above the chart..
The downloads represent the sum over the time grain selected. While unique listeners represents the number of uniques over the selected period. Thus, when Daily, is selected unique listeners over each day are reflected; when Monthly is selected, unique listeners over the month are reflected. Note that unique listener metrics are limited to 31-day periods to ensure accuracy.
Content Page
The Content page shows the top 10 episodes by downloads over your selected date range, as well as downloads by feed. You can select the View All Episodes link on the Top Episodes card to view and export a full list of episodes with downloads over your date range. Clicking on an Episode name in the Top Episodes or Episodes list page will take you to the analytics page for that individual episode.
Percentage column
In the Top Episodes table, the Percentage column shows each episode’s share of total downloads for the date range selected (top right). For example, an episode showing 16% received 16% of the show’s downloads across that window. It is not a comparison to a previous period; changing the date range recalculates each episode’s share.
Audience Page
The Audience page shows the top 10 countries and listening platforms for your series over your selected date range, as well as downloads by distribution type (more info). You can hover/select countries on the Top Locations map to view download values for each country.
You can click on the View All Locations link in the Top Locations card to view and export a full list of location data, which includes Countries, Regions/States, DMAs, and Cities with downloads over your date range. You can filter the Regions and Cities data by country.
You can click on the View All Platforms link in the Top Platforms card to view and export a full list of platforms with downloads over your date range.
Episode Comparison Page
The Episode Comparison feature allows you to evaluate how your episodes perform relative to each other by comparing downloads over equal time periods after their release dates.
Features
- Compare up to 5 episodes' performance based on days since release
- View cumulative downloads across multiple time ranges (7, 30, 60, or 90 days)
- Interactive chart which shows daily cumulative downloads on hover
Using the Chart
The Episode Comparison chart provides a visual representation of your episodes' performance over time. You can select different time ranges to analyze performance across 7, 30, 60, or 90 days, with each data point representing cumulative downloads since the episode's release. By default, the chart displays your five most recent episodes, but you can customize this selection using the episode list below.
The interactive chart allows you to hover over any point to see exact download numbers for each episode at that specific time. Each episode is represented by a distinct colored line to track and compare performance across multiple episodes.
Episode List
Below the chart, you'll find a comprehensive list of all episodes in your series. Each entry displays the episode title, release date, and cumulative downloads for your selected time period (7, 30, 60, or 90 days). The list automatically sorts episodes by release date, with the newest episodes appearing first. If you have multiple feeds, the primary feed's release date is shown. When you select episodes for comparison, they display in the top selected list for easy reference.
Notes and Limitations
If there are multiple feeds, the Episode Comparison feature uses the primary feed's release time as the basis for all calculations. Each day represents a full 24-hour period from the release time, rather than calendar days. Download data from all feeds associated with your series are included to provide comprehensive performance metrics.
Episodes must have either a release date in the past or at least one download to be included in comparisons. Some episodes may have special considerations: imported episodes might show incomplete historical data, and episodes with non-IAB measurement windows may not provide an apples-to-apples comparison.
Episode Analytics
Overview Page
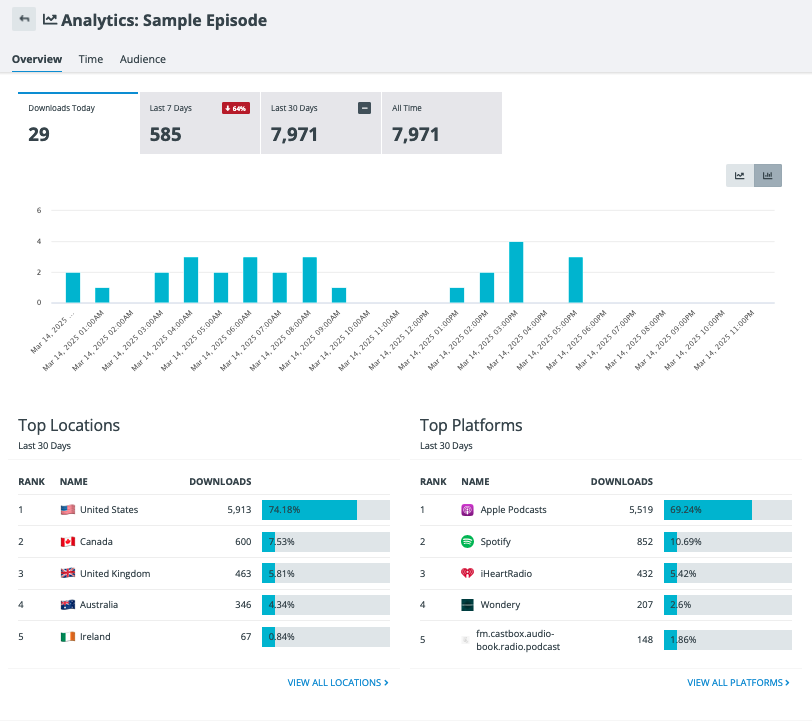
The episode Overview page includes downloads for today, Last 7 days, Last 30 Days, and All Time, with % changes compared to the previous period. You can click on each tab to see its corresponding chart. You can toggle between a line and bar chart using the buttons in the right corner.
You can also see the top locations and listening platforms for your episode in the Last 30 days.
Time Page
The Time page shows total downloads for your episode, with breakouts by time unit (hour, day, week, month) as well as downloads by feed over your selected date range. You can toggle between a line and bar chart using the buttons underneath the export button. You can change the time unit using the dropdown menu above the chart.
Audience Page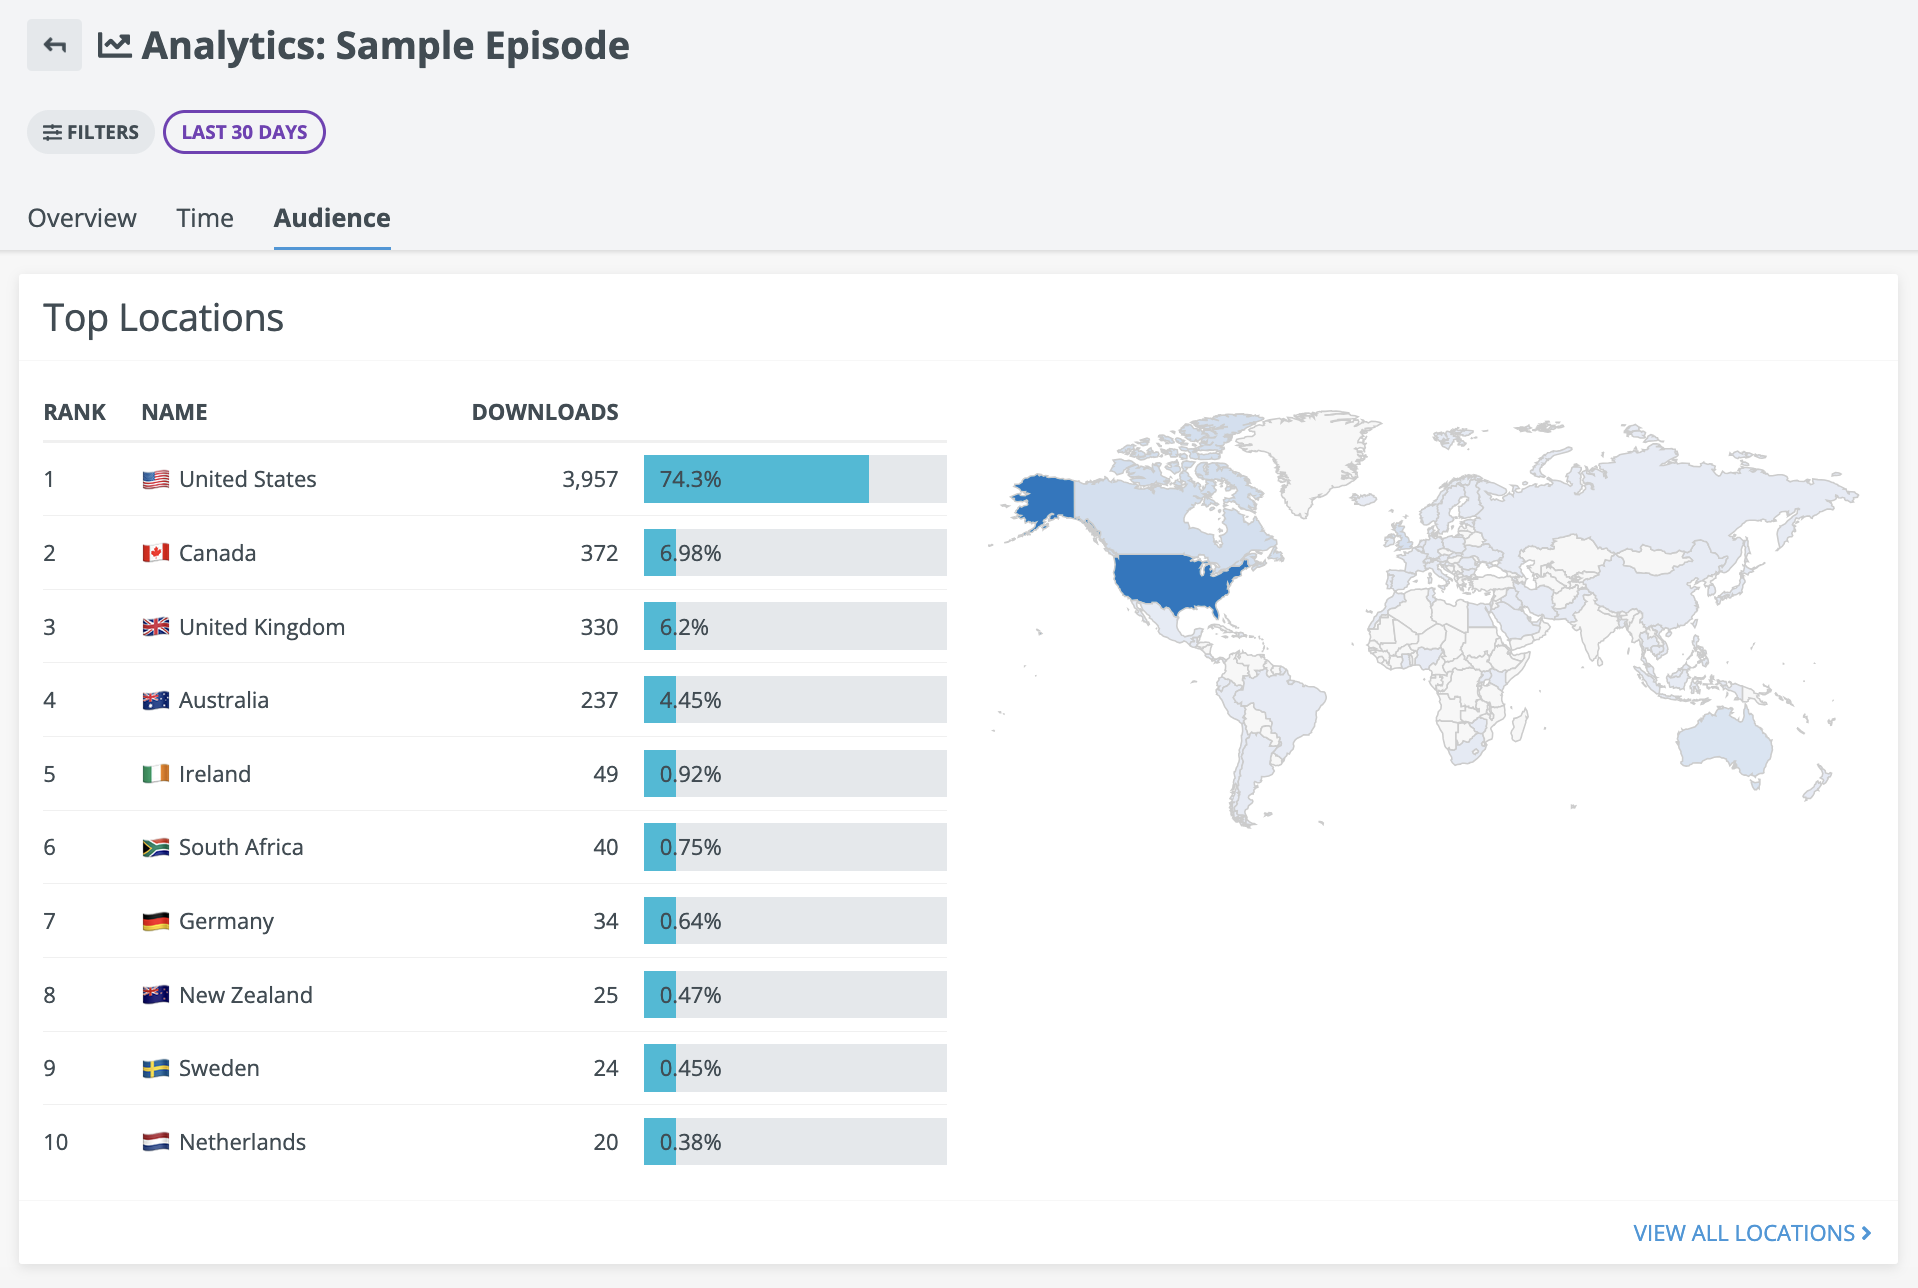
The Audience page shows the top 10 countries and listening platforms for your episode over your selected date range, as well as downloads by distribution type (more info). You can hover/select countries on the Top Locations map to view download values for each country.
You can click on the View All Locations link in the Top Locations card to view and export a full list of location data, which includes Countries, Regions/States, DMAs, and Cities with downloads over your date range. You can filter the Regions and Cities data by country.
You can click on the View All Platforms link in the Top Platforms card to view and export a full list of platforms with downloads over your date range.